This section compiled by Joanna Reiter and Christine Fröhling
1. Objectives
The objective of this analysis is to assess the carbon footprint and environmental impact associated with the travels of SIETAR Congress 24 participants from their place of origin to Lille, France and back. This analysis aims to provide a general understanding of the total greenhouse gas emissions resulting from the transportation choices made by participants, as well as to identify potential areas for improvement in reducing the overall environmental impact of such events in the future.
Furthermore, the report shows the results of the survey related to the food choices made by the participants, either vegetarian or non-vegetarian, as well as the type of accommodation chosen concretely, whether the booked accommodation was meeting sustainability criteria, or not.
In the process of preparation of the report, the sustainability team considered several standards and best practices on the organization of sustainable Congresses. In the Annex 1 to this document is attached the check list we used. Although there was no budget available to purchase the ISO 20121:2024 event sustainability management systems, we reviewed the free of charge summary of the standard, as well as several others. They all indicate that the transport to and from an event, such as an international congress is by far the largest contributor to greenhouse gas emissions related to such event. For this reason, this report focuses on the carbon footprint due to travel of the participants to the congress.
2. Scope of Analysis and System Boundaries
Based on the available data, this analysis is limited to direct greenhouse gas (GHG) emissions from the transport means used by participants to travel to and from the SIETAR Congress 24. For the purposes of this report, we will focus specifically on carbon dioxide (CO2) emissions, which are a significant contributor to climate change. The analysis does not include indirect emissions, such as those from the production of the vehicles, fuel extraction, or infrastructure-related impacts. This streamlined approach allows us to concentrate on the immediate and most directly quantifiable impact of participant travel.
3. Definition of the Functional Unit
The functional unit for this analysis is defined as ‘the carbon footprint per congress participant due to travelling to Lille and back’. This unit allows us to normalize the data and facilitate a comparative analysis of the environmental impact of different transportation methods. By using this approach, we can provide actionable insights into how travel-related emissions could be minimized in future events.
4. Data Used
The data used in this analysis were collected via a voluntary survey distributed to congress participants. We received responses from 92 participants out of 288, which accounts for approximately 30% of the participants in the congress. The survey gathered information on the travel modes chosen by participants, including flights, trains, and other transportation means. Although the data provided is self-reported and may contain inaccuracies or gaps, it offers valuable insights into the travel habits of participants and the resulting environmental impacts. The survey specifically asked for details such as the distance traveled, the mode of transport used, and whether the journey included multiple legs or different types of transportation. It is important to note that while the data provide a broad overview, the accuracy of the findings depends on the completeness and correctness of the information provided by respondents.
5. Tools and Software
To calculate the carbon footprint, we evaluated several software tools and methodologies, taking into account the type and quality of the data available. Given the relatively simple and direct nature of the data, we opted for the SCIF tool, which is designed for straightforward CO2 footprint calculations. This tool was also integrated into the survey, allowing participants to calculate their own carbon footprint based on their travel details. Other tools considered included Open LCA, SimaPro, and Gabi, which are more complex and typically used for comprehensive life cycle assessments (LCA). However, given the scope of this project and the focus on direct emissions from travel, the SCIF tool was deemed appropriate and sufficient.
https://scif.org.uk/web/carbon-calculator
6. Results and Interpretation
The analysis of the carbon footprint for the SIETAR Congress 24 participants’ travel reveals significant variations in emissions depending on the mode of transportation chosen. Below, we provide a detailed breakdown of these results, along with the relevant graphs to illustrate key findings.
Total Carbon Footprint and Breakdown by Transportation Mode
The total carbon footprint generated by the participants’ travel amounted to 73,407.06 kg of CO2. This figure is a comprehensive reflection of the emissions produced solely by transportation, as captured by the survey responses. The breakdown by transportation mode is as follows:
- Public Transport (Train, Boat, Bus): These modes of transportation accounted for a total of 4,281.1 kg of CO2, representing approximately 5.84% of the total footprint.
- Car: Travel by car contributed 501.52 kg of CO2, which is around 0.68% of the total emissions.
- Plane: Air travel was the largest contributor to the carbon footprint, with total emissions of 68,624.44 kg of CO2. This represents a substantial 93.56% of the overall emissions.
The following graph illustrates the distribution of carbon footprints by the different modes of transportation used by participants. As depicted, air travel accounts for the vast majority of emissions, followed by public transport and car travel.
Graph: Distribution of carbon footprints by transport mode
Analysis of Travel Patterns
Most of the intra-European travel was conducted by train, reflecting the accessibility and efficiency of the European rail network. Among the plane travels, 11 were transatlantic flights originating from outside of europe, contributing significantly to the overall carbon footprint. The shortest distance traveled by plane was 600 kilometers from Zurich, followed closely by 642 kilometers from Barcelona. Despite the relatively short distances, these flights still contributed disproportionately to the overall emissions when compared to train travel over similar distances.
Overall, 60% of all travel was done by public transportation, predominantly by train. This relatively high percentage can be attributed to the strategic and convenient location of the venue in Lille, which benefits from excellent train connections from major cities across Europe. The city’s accessibility by rail made it an attractive option for attendees, allowing them to minimize their carbon footprint by choosing a more sustainable mode of transportation.
Moreover, the strong preference for train travel over other forms of public transportation highlights the role of infrastructure and convenience in influencing sustainable travel choices. The ability to access the venue with ease likely contributed to minimizing the environmental impact.
Distribution of Travel Distances
The distribution of travel distances among participants varied widely, reflecting the diverse geographic origins of the attendees. The graph below illustrates the distribution of travel distances:
- 0-300 km: 37.5% of participants traveled within this distance range, likely using train or car, contributing minimally to the overall emissions.
- 301-600 km: 15.90% of participants fell into this category, with some choosing short-haul flights or longer train journeys.
- 601-1000 km: 22.72% of participants traveled within this distance, which may include both train and plane travel.
- 1001-5000 km: 12.5% of participants traveled these longer distances, predominantly by plane.
- Over 5000 km: 11.36% of participants undertook transcontinental journeys, significantly increasing the carbon footprint due to the reliance on air travel.
Graph: Distribution of travel distance
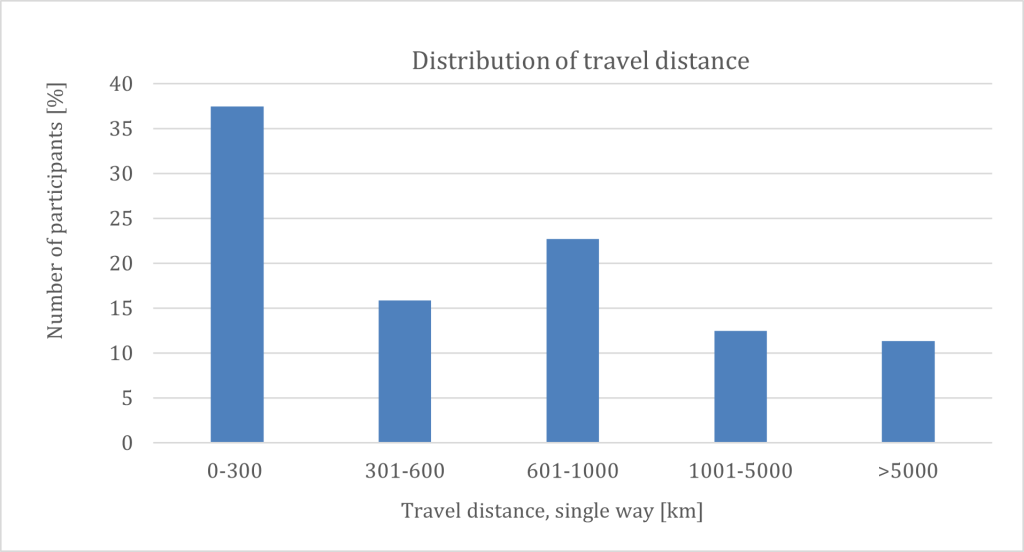
This distribution highlights that while a majority of the participants were able to travel relatively short distances, thereby minimizing their carbon footprint, a notable proportion undertook long-distance journeys that greatly increased the overall emissions.
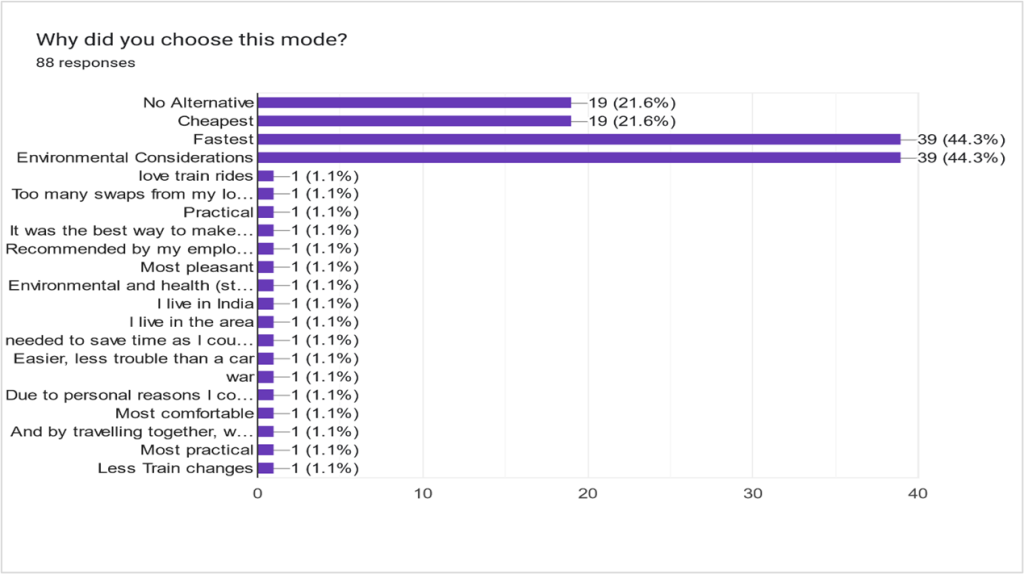
Influencing Factors on Transportation Choices
The survey also revealed several key factors influencing participants’ choice of transportation (see graph below). The primary reasons were evenly split between environmental considerations and the speed of the journey, with each being cited by 44.3% of respondents. This indicates a strong awareness among attendees of the environmental impact of their travel, as well as a need to balance sustainability with the practicality of reaching the venue efficiently.
Following these primary considerations, 21.6% of participants selected their mode of transport based on cost, highlighting the importance of budget in travel decisions. The same percentage (21.6%) reported that they had no alternative to their chosen mode of transportation, underscoring the constraints some travelers faced due to limited options, particularly in the case of transatlantic flights.
These findings suggest that while environmental concerns and travel efficiency are top priorities for many, factors such as cost and availability also play significant roles in the decision-making process. The data underscores the importance of offering sustainable, efficient, and affordable travel options to accommodate the diverse needs and preferences of participants.
Graph: Influencing factors on transportation choices
Comparative Analysis of Emissions Impact
The total carbon footprint generated by the SIETAR Congress 24 participants’ travel was 73,407.06 kg of CO2. To put this into perspective, this amount of CO2 is equivalent to the emissions produced by approximately 8.3 average U.S. homes’ energy use for one year. Alternatively, this is comparable to the carbon sequestered by 1,216 tree seedlings grown for 10 years. This comparison helps to illustrate the significant environmental impact that the travel associated with a single event can have.
By breaking down the emissions by mode of transportation, it’s clear that air travel is the primary contributor to the carbon footprint, accounting for over 93% of the total emissions. Public transport and car travel, although contributing less to the overall emissions, still represent areas where further reductions could be explored.
Context: Net-Zero Emissions Targets
Achieving net-zero greenhouse gas emissions is a global priority, especially as countries aim to meet the goals of the Paris Agreement. The concept of net-zero emissions refers to the balance between the amount of greenhouse gases produced and the amount removed from the atmosphere. This balance is crucial to limiting global temperature rise to 1.5°C or 2°C above pre-industrial levels, as outlined by international climate agreements.
Countries and organizations around the world are increasingly committing to net-zero targets, with over 90 nations having communicated such goals. However, achieving net-zero emissions requires significant transformations across various sectors, including energy, transportation, and agriculture. For events like the SIETAR Congress 24, this means rethinking transportation options, promoting sustainable practices, and potentially exploring carbon offsetting strategies to mitigate the environmental impact of travel.
In the context of these global efforts, the findings from this carbon footprint analysis underscore the importance of considering sustainable travel options and other emissions-reducing strategies in the planning of future events. By aligning event practices with broader net-zero goals, organizers can contribute to global efforts to curb climate change while setting an example for others in the industry.
This analysis not only highlights the immediate impact of travel on event-related emissions but also serves as a call to action for integrating sustainability into every aspect of event planning and execution, in line with the growing momentum toward net-zero emissions globally.
Sources: WRI insights on net-zero emissions (World Resources Institute).
7. Analysis of Food Choices and Accommodation Preferences
In addition to the carbon footprint analysis, the SIETAR Congress 24 survey also explored participants’ food choices and accommodation preferences, which provide valuable insights into their behaviors and sustainability considerations. While no emissions calculations were performed due to a lack of specific data, the survey responses shed light on the sustainability preferences and challenges faced by attendees.
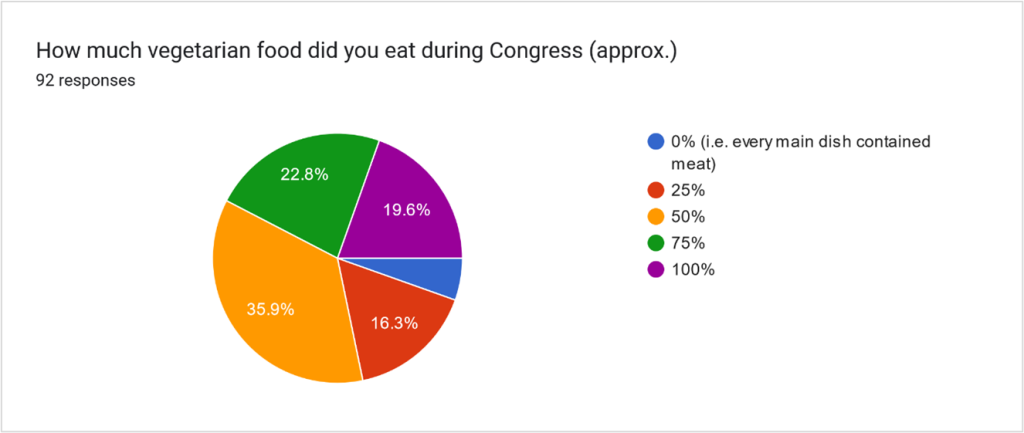
Food Choices
According to the survey data, 20% of the Congress participants chose to eat 100% vegetarian meals, while 36% included meat in less than 50% of their meals. Analyzing the dietary behavior of Congress participants is a significant element in the overall effort to reduce emissions, as dietary choices, particularly the reduction of meat consumption, play a crucial role in lowering an event’s overall carbon footprint. Although the exact emissions impact of these dietary choices was not calculated, the positive reception towards vegetarian options reflects a growing awareness and willingness among participants to adopt more sustainable eating habits.
Graph: Vegetarian meals choices
The survey asked participants to rate the ease of obtaining vegetarian options during the congress. The majority of respondents indicated that it was relatively easy to find vegetarian meals, with most ratings leaning towards the higher end of the scale. This suggests that the event organizers successfully provided a variety of food options, accommodating those who prefer plant-based diets.
Graph: Ease of obtaining vegetarian meals
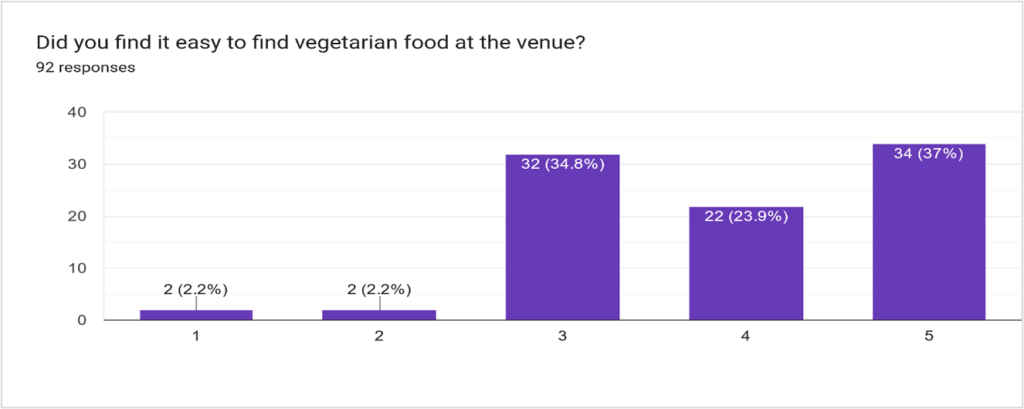
1=Not Easy, 5=No problem getting vegetarian
Accommodation Preferences
Regarding accommodation, participants were asked to rate the availability of sustainable lodging options. The responses were varied, with some participants finding it relatively easy to secure eco-friendly accommodation, while others faced challenges. The availability of sustainable lodging options appeared to be location-dependent, suggesting that while some regions offer a good selection of green hotels or eco-lodges, others may still be lacking in this area.
This feedback highlights the importance of ensuring that future events not only promote but also facilitate access to sustainable accommodation. Encouraging participants to choose eco-friendly lodging can significantly contribute to reducing the overall environmental impact of an event.
Graph: Availability of sustainable accommodation options
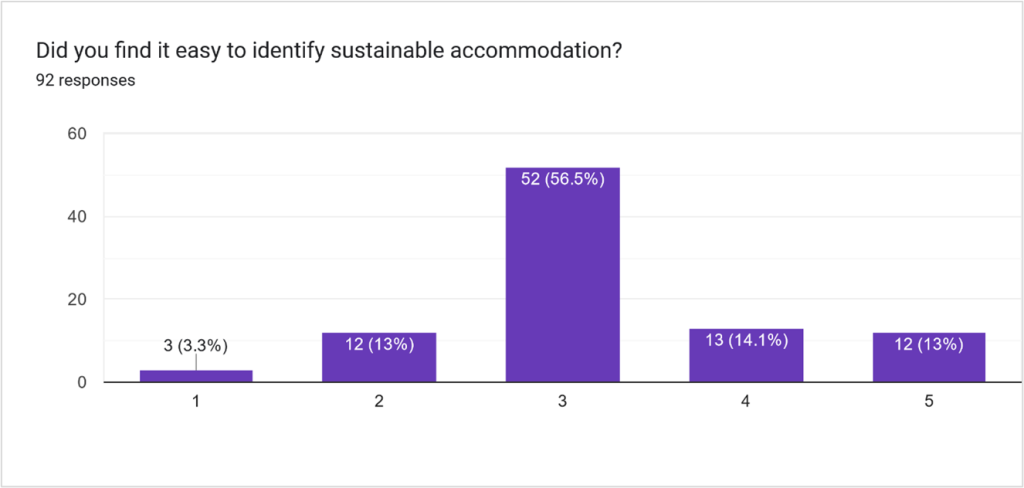
1=Really difficult, 5=Lots of options
8. Conclusions and Recommendations
Summary
The SIETAR Congress 24 carbon footprint analysis highlights the significant environmental impact of participant travel, with air travel contributing the most to overall emissions. The analysis also reveals that a substantial portion of attendees would have opted for more sustainable travel, diet, and accommodation choices if they were available and practical. Although the results indicate room for improvement in making sustainability a priority, they also reflect a growing awareness of the importance of reducing carbon footprints among participants. This momentum should be leveraged in the planning of the next event.
Recommendations for Future Congresses
- Venue selection: Choose a venue with convenient access to sustainable transportation options, such as Lille, which benefits from excellent rail connections. This will encourage participants to opt for lower-emission travel options like trains.
- Proactive communication on sustainable travel and accommodation: Begin communicating well in advance about sustainable transportation and accommodation options. Provide participants with clear information on how to book eco-friendly hotels and emphasize the benefits of choosing public transportation over flights or car travel. Additionally, facilitate connections between participants to encourage car sharing when train travel is not a feasible option. This approach not only promotes sustainability but also fosters collaboration and community among attendees.
- Sustainable food options and catering practices: Continue to offer and promote a diverse selection of vegetarian and plant-based meal options, as these choices are well-received by participants and play a crucial role in reducing the event’s overall carbon footprint. To enhance the sustainability of the catering services, it is recommended to engage with catering suppliers to review their policies and sourcing practices. Priority should be given to suppliers who emphasize sustainable sourcing, including the use of local, seasonal, and natural ingredients. Additionally, vegetarian and plant-based options should be favored, as they generally have a lower environmental impact. Where possible, collaborate with suppliers who are committed to reducing food waste and who utilize eco-friendly packaging, further minimizing the event’s environmental footprint.
- Sustainable accommodation: Facilitate access to sustainable lodging by partnering with eco-friendly hotels and providing participants with a list of recommended options. Encourage participants to choose green-certified accommodations.
- Carbon offsetting initiatives: Consider introducing carbon offsetting initiatives for those who must travel by air. This could involve investing in renewable energy projects or reforestation programs to balance the carbon emissions from flights.
- Enhanced data collection: For future events, aim to collect more detailed data on participants’ travel and accommodation choices to better assess the overall environmental impact and explore additional areas for improvement.
The implementation of these recommendations will help align future congresses with global net-zero emissions targets, contributing to the broader effort to mitigate climate change.